Traces
To see exactly what your agent did on a request, trace its execution end to end: every model interaction, retriever call, tool call, and event loop cycle. Strands builds these traces on the OpenTelemetry standard, so they capture the full path of a request through your agent.
Understanding Traces in Strands
Section titled “Understanding Traces in Strands”Traces in Strands provide a hierarchical view of your agent’s execution, allowing you to:
- Track the entire agent lifecycle: From initial prompt to final response
- Monitor individual LLM calls: Examine prompts, completions, and token usage
- Analyze tool execution: Understand which tools were called, with what parameters, and their results
- Measure performance: Identify bottlenecks and optimization opportunities
- Debug complex workflows: Follow the exact path of execution through multiple cycles
Each trace consists of multiple spans that represent different operations in your agent’s execution flow:
+-------------------------------------------------------------------------------------+| Strands Agent || - gen_ai.system: <system name> || - gen_ai.agent.name: <agent name> || - gen_ai.operation.name: <operation> || - gen_ai.request.model: <model identifier> || - gen_ai.event.start_time: <timestamp> || - gen_ai.event.end_time: <timestamp> || - gen_ai.user.message: <user query> || - gen_ai.choice: <agent response> || - gen_ai.usage.prompt_tokens: <number> || - gen_ai.usage.input_tokens: <number> || - gen_ai.usage.completion_tokens: <number> || - gen_ai.usage.output_tokens: <number> || - gen_ai.usage.total_tokens: <number> || - gen_ai.usage.cache_read.input_tokens: <number> || - gen_ai.usage.cache_creation.input_tokens: <number> || || +-------------------------------------------------------------------------------+ || | Cycle <cycle-id> | || | - gen_ai.user.message: <formatted prompt> | || | - gen_ai.assistant.message: <formatted prompt> | || | - event_loop.cycle_id: <cycle identifier> | || | - gen_ai.event.end_time: <timestamp> | || | - gen_ai.choice | || | - tool.result: <tool result data> | || | - message: <formatted completion> | || | | || | +-----------------------------------------------------------------------+ | || | | Model invoke | | || | | - gen_ai.system: <system name> | | || | | - gen_ai.operation.name: <operation> | | || | | - gen_ai.user.message: <formatted prompt> | | || | | - gen_ai.assistant.message: <formatted prompt> | | || | | - gen_ai.request.model: <model identifier> | | || | | - gen_ai.event.start_time: <timestamp> | | || | | - gen_ai.event.end_time: <timestamp> | | || | | - gen_ai.choice: <model response with tool use> | | || | | - gen_ai.usage.prompt_tokens: <number> | | || | | - gen_ai.usage.input_tokens: <number> | | || | | - gen_ai.usage.completion_tokens: <number> | | || | | - gen_ai.usage.output_tokens: <number> | | || | | - gen_ai.usage.total_tokens: <number> | | || | | - gen_ai.usage.cache_read.input_tokens: <number> | | || | | - gen_ai.usage.cache_creation.input_tokens: <number> | | || | +-----------------------------------------------------------------------+ | || | | || | +-----------------------------------------------------------------------+ | || | | Tool: <tool name> | | || | | - gen_ai.event.start_time: <timestamp> | | || | | - gen_ai.operation.name: <operation> | | || | | - gen_ai.tool.name: <tool name> | | || | | - gen_ai.tool.call.id: <tool use identifier> | | || | | - gen_ai.event.end_time: <timestamp> | | || | | - gen_ai.choice: <tool execution result> | | || | | - tool.status: <execution status> | | || | +-----------------------------------------------------------------------+ | || +-------------------------------------------------------------------------------+ |+-------------------------------------------------------------------------------------+OpenTelemetry Integration
Section titled “OpenTelemetry Integration”Strands natively integrates with OpenTelemetry, an industry standard for distributed tracing. This integration provides:
- Compatibility with existing observability tools: Send traces to platforms like Jaeger, Grafana Tempo, AWS X-Ray, Datadog, and more
- Standardized attribute naming: Using the OpenTelemetry semantic conventions
- Flexible export options: Console output for development, OTLP endpoint for production
- Auto-instrumentation: Trace creation is handled automatically when you enable tracing
Enabling Tracing
Section titled “Enabling Tracing”Environment Variables
Section titled “Environment Variables”# Specify custom OTLP endpointexport OTEL_EXPORTER_OTLP_ENDPOINT="http://collector.example.com:4318"
# Set Default OTLP Headersexport OTEL_EXPORTER_OTLP_HEADERS="key1=value1,key2=value2"
# Opt into the latest OTEL semantic conventions, and send tool definitions as spans.# Setting gen_ai_latest_experimental also drops the deprecated cache-token aliases# (see Captured Attributes below).export OTEL_SEMCONV_STABILITY_OPT_IN="gen_ai_latest_experimental,gen_ai_tool_definitions"Code Configuration
Section titled “Code Configuration”from strands import Agent
# Option 1: Skip StrandsTelemetry if global tracer provider and/or meter provider are already configured# (your existing OpenTelemetry setup will be used automatically)agent = Agent( model="global.anthropic.claude-sonnet-5", system_prompt="You are a helpful AI assistant")
# Option 2: Use StrandsTelemetry to handle complete OpenTelemetry setup# (Creates new tracer provider and sets it as global)from strands.telemetry import StrandsTelemetry
strands_telemetry = StrandsTelemetry()strands_telemetry.setup_otlp_exporter() # Send traces to OTLP endpointstrands_telemetry.setup_console_exporter() # Print traces to consolestrands_telemetry.setup_meter( enable_console_exporter=True, enable_otlp_exporter=True) # Setup new meter provider and sets it as global
# Option 3: Use StrandsTelemetry with your own tracer provider# (Keeps your tracer provider, adds Strands exporters without setting global)from strands.telemetry import StrandsTelemetry
strands_telemetry = StrandsTelemetry(tracer_provider=user_tracer_provider)strands_telemetry.setup_meter(enable_otlp_exporter=True)strands_telemetry.setup_otlp_exporter().setup_console_exporter() # Chaining supported
# Create agent (tracing will be enabled automatically)agent = Agent( model="global.anthropic.claude-sonnet-5", system_prompt="You are a helpful AI assistant")
# Use agent normallyresponse = agent("What can you help me with?")import { Agent } from '@strands-agents/sdk'
// Option 1: Skip setupTracer() if a global tracer provider is already configured// (your existing OpenTelemetry setup will be used automatically)const agent = new Agent({ systemPrompt: 'You are a helpful AI assistant',})
import { Agent } from '@strands-agents/sdk'import { setupTracer } from '@strands-agents/sdk/telemetry'
// Option 2: Use setupTracer() to handle complete OpenTelemetry setup// (creates a new tracer provider and registers it as global)setupTracer({ exporters: { otlp: true, console: true }, // Send traces to OTLP endpoint and console debug})
import { Agent } from '@strands-agents/sdk'import { setupTracer } from '@strands-agents/sdk/telemetry'import { NodeTracerProvider } from '@opentelemetry/sdk-trace-node'
// Option 3: Use setupTracer() with your own tracer providerconst provider = new NodeTracerProvider()setupTracer({ provider, exporters: { otlp: true, console: true },})
// Create agent (tracing will be enabled automatically)const agent = new Agent({ systemPrompt: 'You are a helpful AI assistant',})
// Use agent normallyconst result = await agent.invoke('What can you help me with?')Trace Structure
Section titled “Trace Structure”Strands creates a hierarchical trace structure that mirrors the execution of your agent:
-
Agent Span: The top-level span representing the entire agent invocation
- Contains overall metrics like total token usage and cycle count
- Captures the user prompt and final response
-
Cycle Spans: Child spans for each event loop cycle
- Tracks the progression of thought and reasoning
- Shows the transformation from prompt to response
-
LLM Spans: Model invocation spans
- Contains prompt, completion, and token usage
- Includes model-specific parameters
-
Tool Spans: Tool execution spans
- Captures tool name, parameters, and results
- Measures tool execution time
Captured Attributes
Section titled “Captured Attributes”Strands traces include rich attributes that provide context for each operation:
Agent-Level Attributes
Section titled “Agent-Level Attributes”| Attribute | Description |
|---|---|
gen_ai.system | The agent system identifier (“strands-agents”) |
gen_ai.agent.name | Name of the agent |
gen_ai.user.message | The user’s initial prompt |
gen_ai.choice | The agent’s final response |
system_prompt | System instructions for the agent |
gen_ai.request.model | Model ID used by the agent |
gen_ai.event.start_time | When agent processing began |
gen_ai.event.end_time | When agent processing completed |
gen_ai.usage.prompt_tokens | Total prompt tokens the model processed. For providers that report cache tokens separately (such as Amazon Bedrock and Anthropic), this count includes the cached tokens |
gen_ai.usage.input_tokens | Same value as gen_ai.usage.prompt_tokens, under the semantic-convention name |
gen_ai.usage.completion_tokens | Total tokens used for completions |
gen_ai.usage.output_tokens | Same value as gen_ai.usage.completion_tokens, under the semantic-convention name |
gen_ai.usage.total_tokens | Total token usage |
gen_ai.usage.cache_read.input_tokens | Number of input tokens read from cache (Note: Not all model providers support cache tokens. This defaults to 0 in that case) |
gen_ai.usage.cache_creation.input_tokens | Number of input tokens written to cache (Note: Not all model providers support cache tokens. This defaults to 0 in that case) |
gen_ai.usage.cache_read_input_tokens | Deprecated alias for gen_ai.usage.cache_read.input_tokens, omitted when gen_ai_latest_experimental is set |
gen_ai.usage.cache_write_input_tokens | Deprecated alias for gen_ai.usage.cache_creation.input_tokens, omitted when gen_ai_latest_experimental is set |
Cycle-Level Attributes
Section titled “Cycle-Level Attributes”| Attribute | Description |
|---|---|
event_loop.cycle_id | Unique identifier for the event loop cycle |
gen_ai.user.message | The user’s initial prompt |
gen_ai.assistant.message | Formatted prompt for this event loop cycle |
gen_ai.event.end_time | When the cycle completed |
gen_ai.choice.message | Model’s response for this cycle |
gen_ai.choice.tool.result | Results from tool calls (if any) |
Model Invoke Attributes
Section titled “Model Invoke Attributes”| Attribute | Description |
|---|---|
gen_ai.system | The agent system identifier |
gen_ai.operation.name | Gen-AI operation name |
gen_ai.agent.name | Name of the agent |
gen_ai.user.message | Formatted prompt sent to the model |
gen_ai.assistant.message | Formatted assistant prompt sent to the model |
gen_ai.request.model | Model ID (e.g., “global.anthropic.claude-sonnet-5”) |
gen_ai.event.start_time | When model invocation began |
gen_ai.event.end_time | When model invocation completed |
gen_ai.choice | Response from the model (may include tool calls) |
gen_ai.usage.prompt_tokens | Total prompt tokens the model processed. For providers that report cache tokens separately (such as Amazon Bedrock and Anthropic), this count includes the cached tokens |
gen_ai.usage.input_tokens | Same value as gen_ai.usage.prompt_tokens, under the semantic-convention name |
gen_ai.usage.completion_tokens | Total tokens used for completions |
gen_ai.usage.output_tokens | Same value as gen_ai.usage.completion_tokens, under the semantic-convention name |
gen_ai.usage.total_tokens | Total token usage |
gen_ai.usage.cache_read.input_tokens | Number of input tokens read from cache (Note: Not all model providers support cache tokens. This defaults to 0 in that case) |
gen_ai.usage.cache_creation.input_tokens | Number of input tokens written to cache (Note: Not all model providers support cache tokens. This defaults to 0 in that case) |
gen_ai.usage.cache_read_input_tokens | Deprecated alias for gen_ai.usage.cache_read.input_tokens, omitted when gen_ai_latest_experimental is set |
gen_ai.usage.cache_write_input_tokens | Deprecated alias for gen_ai.usage.cache_creation.input_tokens, omitted when gen_ai_latest_experimental is set |
Tool-Level Attributes
Section titled “Tool-Level Attributes”| Attribute | Description |
|---|---|
tool.status | Execution status (success/error) |
gen_ai.tool.name | Name of the tool called |
gen_ai.tool.call.id | Unique identifier for the tool call |
gen_ai.operation.name | Gen-AI operation name |
gen_ai.event.start_time | When tool execution began |
gen_ai.event.end_time | When tool execution completed |
gen_ai.choice | Formatted tool result |
Visualization and Analysis
Section titled “Visualization and Analysis”Traces can be visualized and analyzed using any OpenTelemetry-compatible tool:
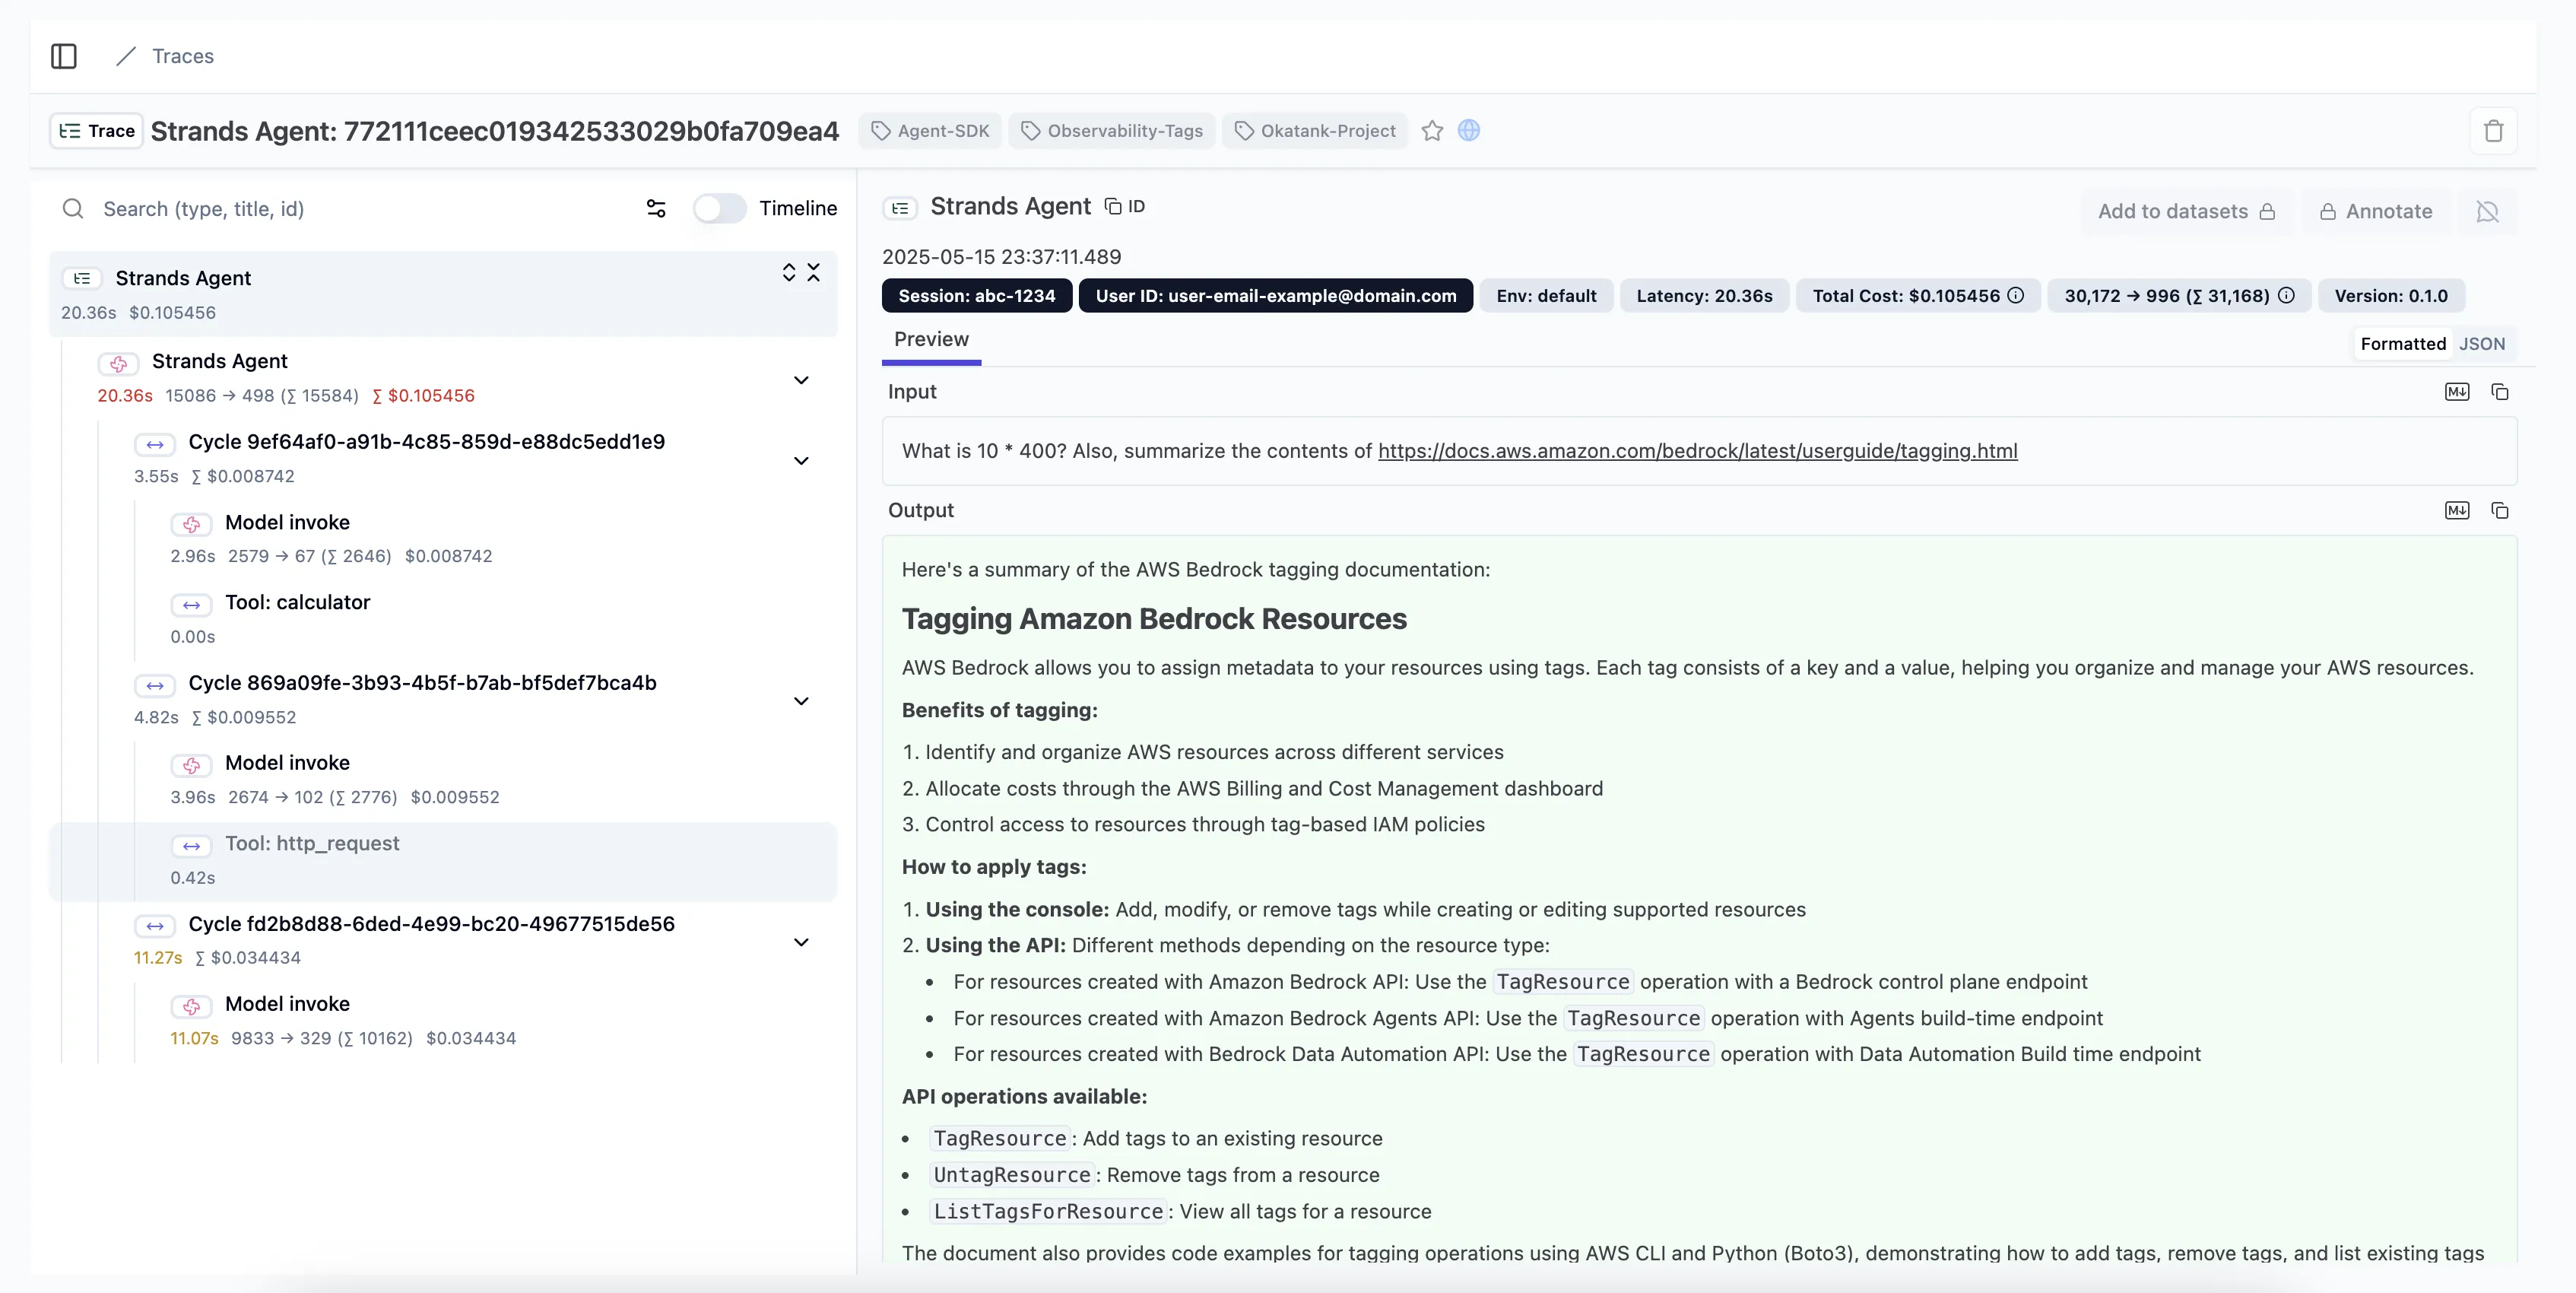
Common visualization options include:
- Jaeger: Open-source, end-to-end distributed tracing
- Langfuse: For Traces, evals, prompt management, and metrics
- AWS X-Ray: For AWS-based applications
- Zipkin: Lightweight distributed tracing
- Opik: For evaluating and optimizing multi-agent systems
Local Development Setup
Section titled “Local Development Setup”For development environments, you can quickly set up a local collector and visualization:
# Pull and run Jaeger all-in-one containerdocker run -d --name jaeger \ -e COLLECTOR_ZIPKIN_HOST_PORT=:9411 \ -e COLLECTOR_OTLP_ENABLED=true \ -p 6831:6831/udp \ -p 6832:6832/udp \ -p 5778:5778 \ -p 16686:16686 \ -p 4317:4317 \ -p 4318:4318 \ -p 14250:14250 \ -p 14268:14268 \ -p 14269:14269 \ -p 9411:9411 \ jaegertracing/all-in-one:latestThen access the Jaeger UI at http://localhost:16686 to view your traces.
You can also setup console export to inspect the spans:
from strands.telemetry import StrandsTelemetry
StrandsTelemetry().setup_console_exporter()
import { setupTracer } from '@strands-agents/sdk/telemetry'
setupTracer({ exporters: { console: true },})Advanced Configuration
Section titled “Advanced Configuration”Sampling Control
Section titled “Sampling Control”For high-volume applications, sample traces to reduce the volume of exported data. The default OpenTelemetry environment variables control sampling:
# Example: Sample 50% of tracesexport OTEL_TRACES_SAMPLER="traceidratio"export OTEL_TRACES_SAMPLER_ARG="0.5"Custom Attribute Tracking
Section titled “Custom Attribute Tracking”You can add custom attributes to any span:
agent = Agent( system_prompt="You are a helpful assistant that provides concise responses.", tools=[http_request, calculator], trace_attributes={ "session.id": "abc-1234", "user.id": "user-email-example@domain.com", "tags": [ "Agent-SDK", "Okatank-Project", "Observability-Tags", ] },)import { Agent } from '@strands-agents/sdk'
const agent = new Agent({ systemPrompt: 'You are a helpful assistant that provides concise responses.', traceAttributes: { 'session.id': 'abc-1234', 'user.id': 'user-email-example@domain.com', tags: ['Agent-SDK', 'Okatank-Project', 'Observability-Tags'], },})Custom Spans
Section titled “Custom Spans”You can access the configured tracer to create your own custom spans alongside the auto-instrumented ones:
from opentelemetry import trace
# Get your configured tracer to optionally create your own custom spanstracer = trace.get_tracer(__name__)with tracer.start_as_current_span("my-custom-operation") as span:    span.set_attribute("custom.key", "value")    # ... do work ...
import { setupTracer, getTracer } from '@strands-agents/sdk/telemetry'
// Set up telemetry first (or register your own NodeTracerProvider)setupTracer({ exporters: { otlp: true } })
// Get a tracer and create custom spansconst tracer = getTracer()const span = tracer.startSpan('my-custom-operation')span.setAttribute('custom.key', 'value')// ... do work ...span.end()Configuring the exporters from source code
Section titled “Configuring the exporters from source code”The StrandsTelemetry().setup_console_exporter() and StrandsTelemetry().setup_otlp_exporter() methods accept keyword arguments that are passed to OpenTelemetry’s ConsoleSpanExporter and OTLPSpanExporter initializers, respectively. This allows you to save the log lines to a file or set up the OTLP endpoints from Python code:
from os import linesepfrom strands.telemetry import StrandsTelemetry
strands_telemetry = StrandsTelemetry()
# Save telemetry to a local file and configure the serialization formatlogfile = open("my_log.jsonl", "wt")strands_telemetry.setup_console_exporter(    out=logfile,    formatter=lambda span: span.to_json() + linesep,)# ... your agent-running code goes here ...logfile.close()
# Configure OTLP endpoints programmaticallystrands_telemetry.setup_otlp_exporter(    endpoint="http://collector.example.com:4318",    headers={"key1": "value1", "key2": "value2"},)
For more information about the accepted arguments, refer to ConsoleSpanExporter and OTLPSpanExporter in the OpenTelemetry API documentation.
The telemetry.setupTracer() function reads OTLP configuration from standard OpenTelemetry environment variables (OTEL_EXPORTER_OTLP_ENDPOINT, OTEL_EXPORTER_OTLP_HEADERS). For full control over exporter configuration, provide your own NodeTracerProvider:
import { setupTracer } from '@strands-agents/sdk/telemetry'import { NodeTracerProvider } from '@opentelemetry/sdk-trace-node'import {  BatchSpanProcessor,  SimpleSpanProcessor,  ConsoleSpanExporter,} from '@opentelemetry/sdk-trace-base'import { OTLPTraceExporter } from '@opentelemetry/exporter-trace-otlp-http'
const provider = new NodeTracerProvider({  spanProcessors: [    // Configure OTLP endpoint programmatically    new BatchSpanProcessor(      new OTLPTraceExporter({        url: 'http://collector.example.com:4318/v1/traces',        headers: { key1: 'value1', key2: 'value2' },      })    ),    // Add console exporter for debugging    new SimpleSpanProcessor(new ConsoleSpanExporter()),  ],})
// Register the provider with StrandssetupTracer({ provider })
For more information about the accepted arguments, refer to the OpenTelemetry JS documentation.
Best Practices
Section titled “Best Practices”- Use appropriate detail level: Balance between capturing enough information and avoiding excessive data
- Add business context: Include business-relevant attributes like customer IDs or transaction values
- Implement sampling: For high-volume applications, use sampling to reduce data volume
- Secure sensitive data: Avoid capturing PII or sensitive information in traces
- Correlate with logs and metrics: Use trace IDs to link traces with corresponding logs
- Monitor storage costs: Be aware of the data volume generated by traces
Common Issues and Solutions
Section titled “Common Issues and Solutions”| Issue | Solution |
|---|---|
| Missing traces | Check that your collector endpoint is correct and accessible |
| Excessive data volume | Implement sampling or filter specific span types |
| Incomplete traces | Ensure all services in your workflow are properly instrumented |
| High latency | Consider using batching and asynchronous export |
| Missing context | Use context propagation to maintain trace context across services |
Example: End-to-End Tracing
Section titled “Example: End-to-End Tracing”This example demonstrates capturing a complete trace of an agent interaction:
from strands import Agentfrom strands.telemetry import StrandsTelemetryimport os
os.environ["OTEL_EXPORTER_OTLP_ENDPOINT"] = "http://localhost:4318"strands_telemetry = StrandsTelemetry()strands_telemetry.setup_otlp_exporter()      # Send traces to OTLP endpointstrands_telemetry.setup_console_exporter()   # Print traces to console
# Create agentagent = Agent(    model="global.anthropic.claude-sonnet-5",    system_prompt="You are a helpful AI assistant")
# Execute a series of interactions that will be tracedresponse = agent("Find me information about Mars. What is its atmosphere like?")print(response)
# Ask a follow-up that uses toolsresponse = agent("Calculate how long it would take to travel from Earth to Mars at 100,000 km/h")print(response)
# Each interaction creates a complete trace that can be visualized in your tracing tool
import { Agent } from '@strands-agents/sdk'import { setupTracer } from '@strands-agents/sdk/telemetry'
// Set environment variables for OTLP endpointprocess.env.OTEL_EXPORTER_OTLP_ENDPOINT = 'http://localhost:4318'
// Configure telemetrysetupTracer({ exporters: { otlp: true, console: true },})
// Create agentconst agent = new Agent({ systemPrompt: 'You are a helpful AI assistant',})
// Execute interactions that will be tracedconst response = await agent.invoke( 'Find me information about Mars. What is its atmosphere like?')console.log(response)
// Each interaction creates a complete trace that can be visualized in your tracing toolSending traces to CloudWatch X-ray
Section titled “Sending traces to CloudWatch X-ray”There are several ways to send traces, metrics, and logs to CloudWatch. Please visit the following pages for more details and configurations:
- Please ensure Transaction Search is enabled in CloudWatch.
Third-party observability backends
Section titled “Third-party observability backends”Because Strands emits standard OpenTelemetry spans, you can point them at whichever observability backend you already use. Set the OTLP endpoint and headers (see Environment Variables) to your provider, or follow the provider’s own Strands guide:
| Backend | Integration guide |
|---|---|
| Langfuse | Observability for Strands Agents with Langfuse |
| Arize Phoenix | Strands Agents Tracing |
| Braintrust | Strands Agent SDK |
| LangSmith | Trace Strands Agents applications |
Any OpenTelemetry-compatible backend works the same way: Strands does not require a specific provider, so you keep your existing tracing setup when you adopt it.